
Summary:
When a potential customer lands on your website, your content needs to be incredibly easy to consume. If your pages take ten seconds to load, shift around erratically while reading, or freeze when a user clicks a button, visitors will leave. It doesn’t matter how great your content or SEO is if the user experience (UX) is broken.
To standardize what “good UX” actually looks like, Google introduced Web Vitals a set of technical, measurable signals that indicate whether a website provides a pleasant experience or a frustrating one. Because showing a slow, glitchy website directly harms Google’s own user experience, they simply will not rank poor-performing sites. Improving these metrics is one of the fastest ways to improve your organic search rankings.
Here is what this guide will cover:
Core Web Vitals: A deep dive into the three most critical metrics Google prioritizes. Largest Contentful Paint (LCP), Interaction to Next Paint (INP), and Cumulative Layout Shift (CLS).
Other Important Web Vitals: real-world breakdowns of secondary vitals that help pinpoint technical issues, including FCP, TTFB, TBT, and Speed Index.
Testing & Troubleshooting: How to use Google’s tools (like PageSpeed Insights and Google Search Console) and what to do if your site’s data is missing from the CrUX database.
CMO Action Steps: A monthly framework and a checklist of official documentation you can hand directly to your web development team to ensure your website passes the test.
Table of Contents
When it comes to SEO, most of the chatter on the Internet is about keywords, content optimization, backlinks and so on. But there are some very important aspects that often get ignored in the noise.
One of the most important of them is Web Vitals and today we are going to demystify it from a CMO’s lens.
Let’s start by setting up the groundwork.
Why Web Vitals
You would agree that a sure-shot win for a website as a marketing channel is when a potential customer stays on your website for long and consumes your content. Right?
The next step of course is to convince them to enquire about your offerings and convert them into a customer. But for all that to happen, they must stay on the website. That is why we make content.
But what if your content is hard to consume? Meaning, what if your font is too small or your website has yellow text over white making it hard to read. What if your website takes 10 secs to load? Do you think your potential customer would compromise and stay on your website just to consume your content?
This is User Experience or UX. A good quality UX is essential for any of your content to work.
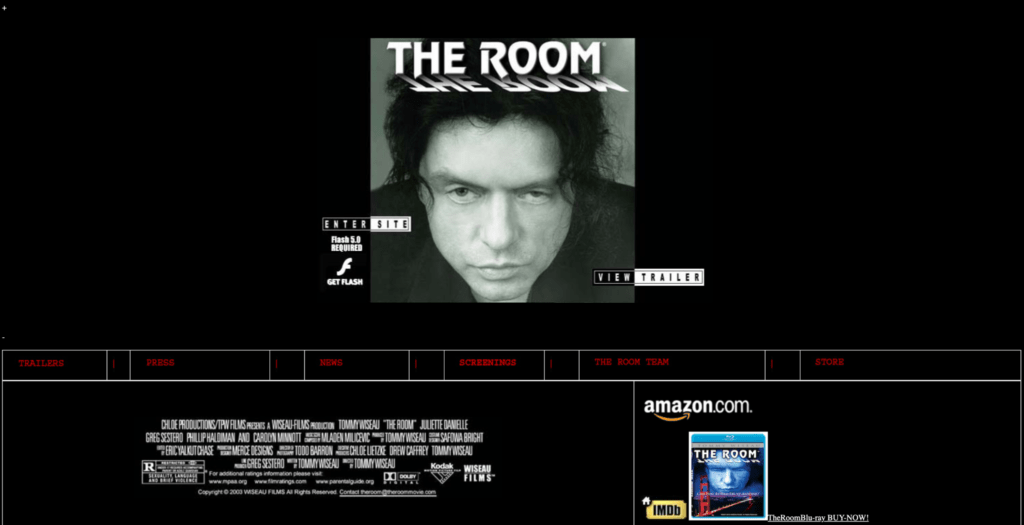
Here is an example of a movie website called the Room. See how difficult it is to read or navigate on the website
Now, many of the aspects of User Experience can be subjective which makes it difficult for people to have a standard on what makes a good quality UX on a website.
This is where Google’s Web Vitals come in.
Google’s Web Vitals
Web Vitals is an Initiative by Google to standardize some metrics that indicate “Good UX” for a website. They looked at technical signals that would indicate that a website could give a pleasant experience to the visitor.
How? For example, if your website loads fast that’s a positive signal. Because the visitor doesn’t have to wait for long hours to browse your website.
Another example, if you do not have too many moving layouts on the website, if your website’s text and background has good contrast, if your website has easy navigation – all these are measurable signals that your website is easy to browse.
That’s Web Vitals. A set of metrics that simplify the guidance on what makes a good User Experience on a website. Of this set of metrics, Google identified a few metrics that matter the most. They called them, Core Web Vitals.
Now, let’s understand what these metrics are and how you can improve them.
Understanding Core Web Vitals
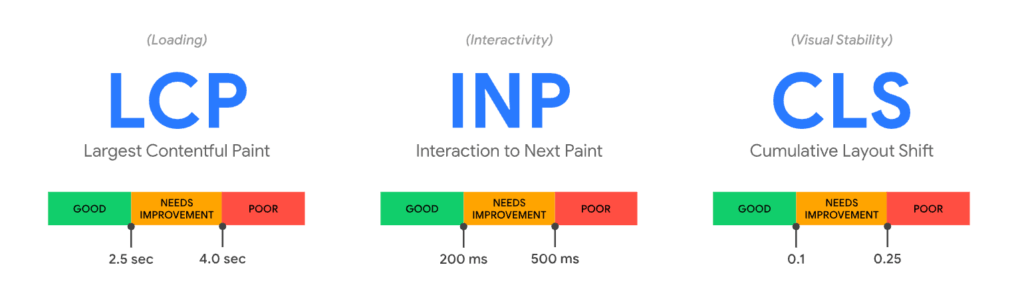
There are 3 Core Web Vitals that Google considers as the most important in determining a good user experience on the website.
The facets they consider most important are Loading, Interactivity and Visual Stability. For each they have identified one metric to measure and a threshold to identify what will be considered a good score.
Let’s go through each one:
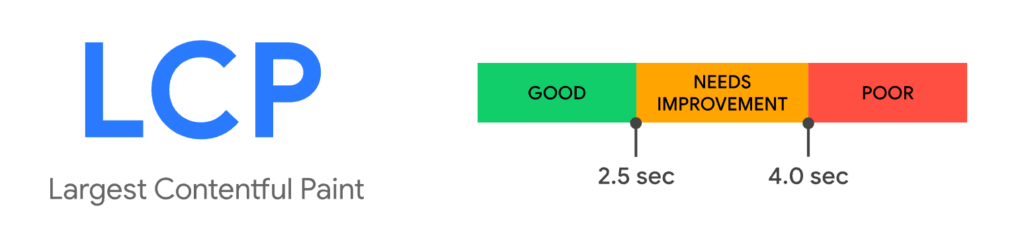
LCP – Largest Contentful Paint (website’s Loading performance)
To measure “Loading” performance, Google looks at LCP (Largest Contentful Paint). LCP essentially looks at the largest piece of content visible on the screen and checks how long it takes to display the whole piece.
This piece of content could be an image, text or a video depending on what you have on the top most part of your website page. As per Google, the largest piece of content on your page must load within 2.5 secs. Anything more impacts the visitor’s experience negatively.
LCP example
Let’s look at an example of CNN.com to see what “Largest piece of content on screen” means.
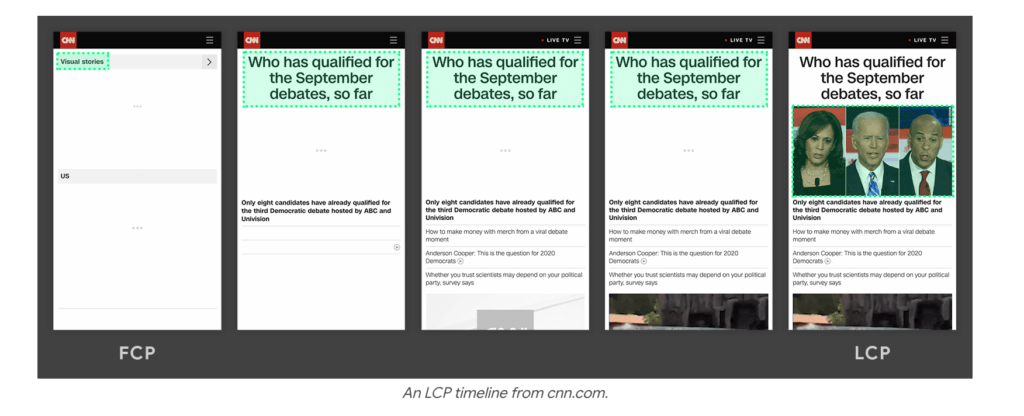
As you can see, the largest piece of content on the screen is the image marked in green. It loads the last in this case. So, the LCP will be the total time from 0 to the time when the image gets loaded.
What LCP is NOT
However, it is not necessary that the largest piece loads the last on a website. Sometimes, it loads sooner than the other elements on the screen. LCP checks the time taken till the largest piece loads. It is NOT the time taken for the entire page to load.
Here is an example where the largest image (marked in green) loaded sooner than the other elements:
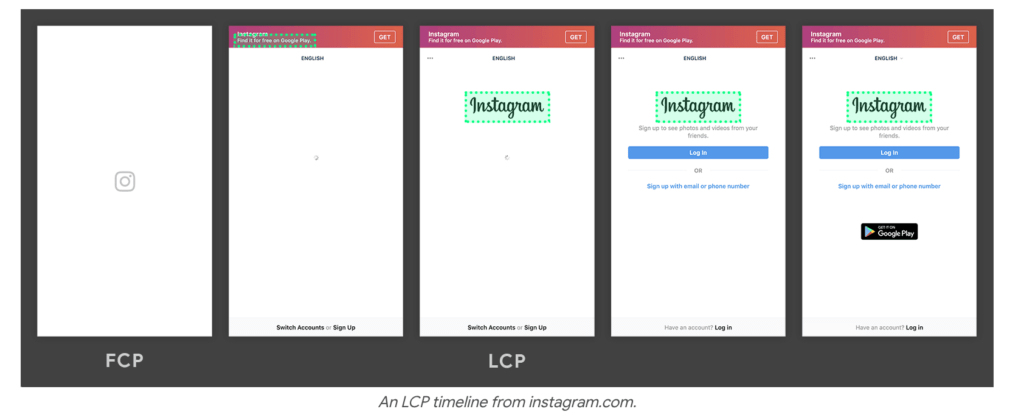
So, sooner the largest content loads, lower the LCP and better your score.
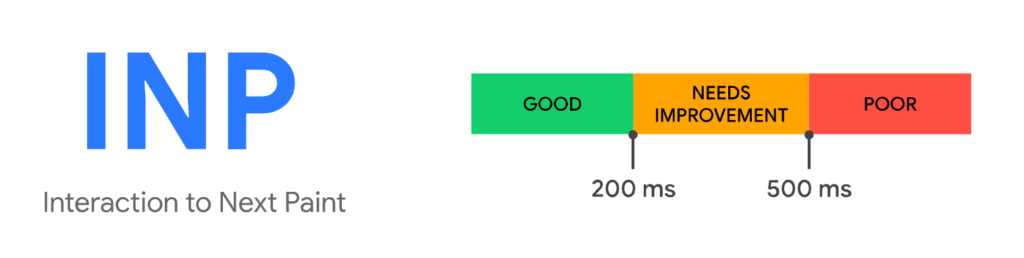
INP – Interaction to Next Paint (website’s Interactivity performance)
To measure “Interactivity” performance, Google looks at Interaction to Next Paint or INP.
INP checks the time taken for a visual feedback on the page after a visitor has interacted with the page.
For example, when you add an item to cart the color of the button changes, telling you the item was added. Or when you click on a “contact us” button, there is a visual change in the button color, telling you the website has received the input.
This is important because when there is no visual feedback of an action or it is delayed, the visitor thinks either that the interaction did not happen or that it is broken.
As per Google, it should take less than 200 ms for the visual feedback, to ensure a good experience.
INP example
Here is an example of it a poor experience vs a good experience of INP:
On the left example, we can see that the accordion menu takes a while before it opens. This makes the visitor think that the click was not received and he clicks again. But in reality, both the clicks were received but there was a delay in the reaction. And since there were two clicks, the accordion opens and immediately closes – leading to a poor experience for the user.
On the right, the according responds quickly making the user have a good experience.
What INP is NOT
Note that, the eventual action of the interaction is not what INP is measuring, it is the time taken for a visual feedback. So, if there is a form submit button being clicked, INP is NOT the time till the next “Thank you” page loads but the time it takes to tell that the button was clicked.
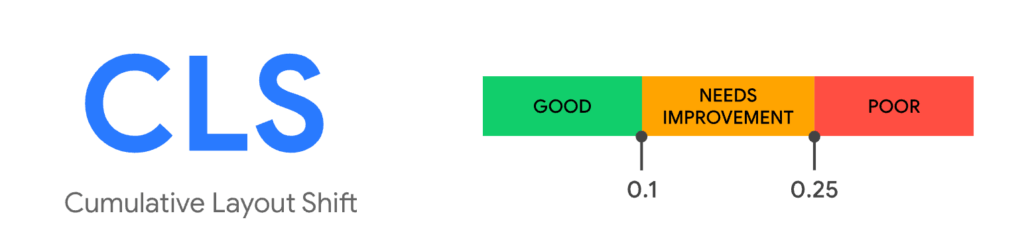
CLS – Cumulative Layout Shift (website’s Visual Stability)
CLS basically measures how much the elements on your website move around.
You may have noticed that on some websites the layout keeps shifting when you are trying to interact with the page. Some of them can be harmless but others can even lead to monetary loss. Here is an example of a harmful layout shift:
As per Google, any shift of more than 0.1 leads to poor user experience.
How CLS score is calculated
To calculate CLS score two aspects are observed:
1. How much of the screen was impacted from before to after the shift.
2. How much the element moved on the screen.
Both these numbers are measured in percentages w.r.t to the screen. Here is an example:
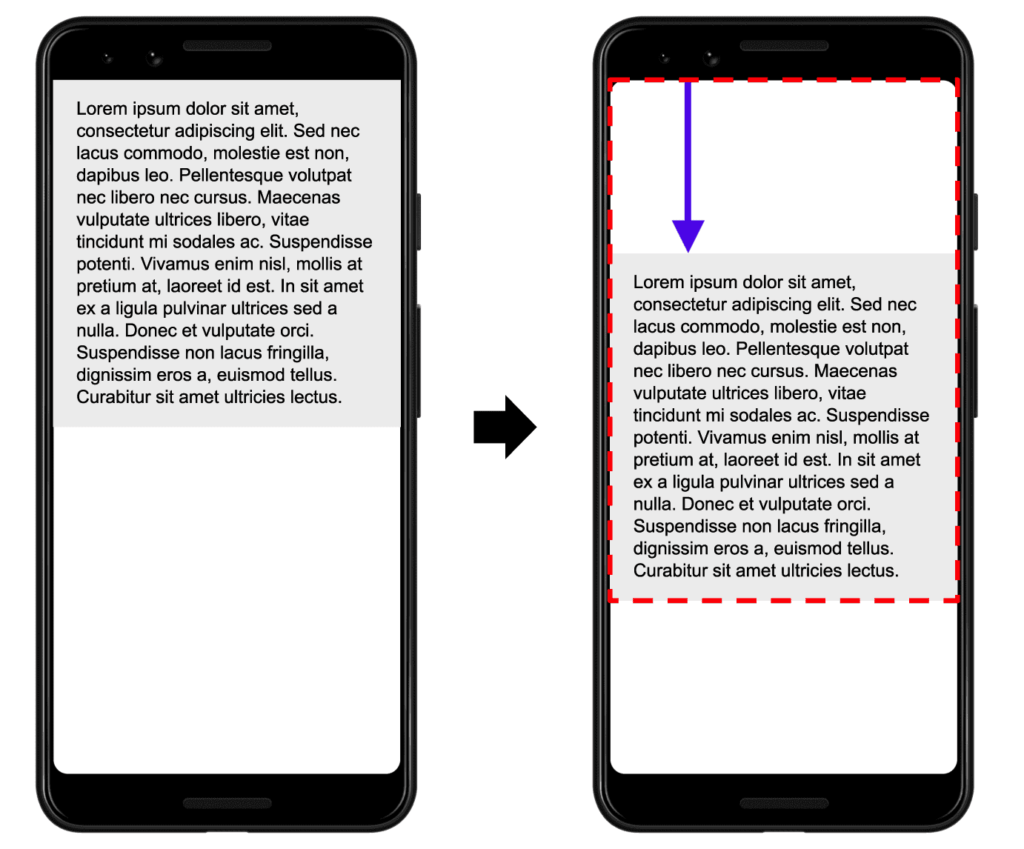
In the above example the text block shifted down and the total impact area was about 75% of the screen (marked in red border).
The movement was about 25% down from the top. (marked in blue arrow) That is the distance factor. So, the CLS score would be 75% * 25% = 0.1875.
You can read more about the CLS calculation here.
How Core Web Vital thresholds are decided
You may be wondering how Google arrived at these thresholds for the metrics?
Well, since they capture these metrics for millions of websites, they simply put the 75th percentile as the threshold for “good” score in each metric. Anything below 25th percentile is considered “poor”.
You can read more about the thresholds here.
Other important Web Vitals
As I mentioned before, the above three are not the only metrics in Web Vitals.
Core Web Vitals are a sub-set. There are other metrics that matter too. Let’s go through some of them:
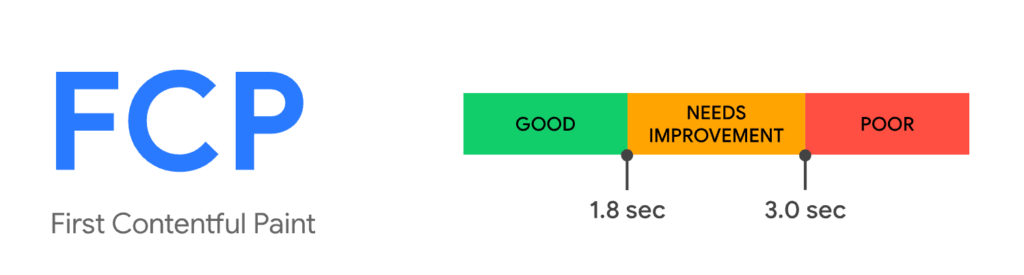
FCP – First Contentful Paint
FCP checks the time taken for the first piece of content to show up on screen. Unlike LCP, which tracks the largest piece of content, FCP is looking at the first one that shows up. Let’s take an example to understand it better.
As per Google, a good score for FCP is 1.8 secs or less.
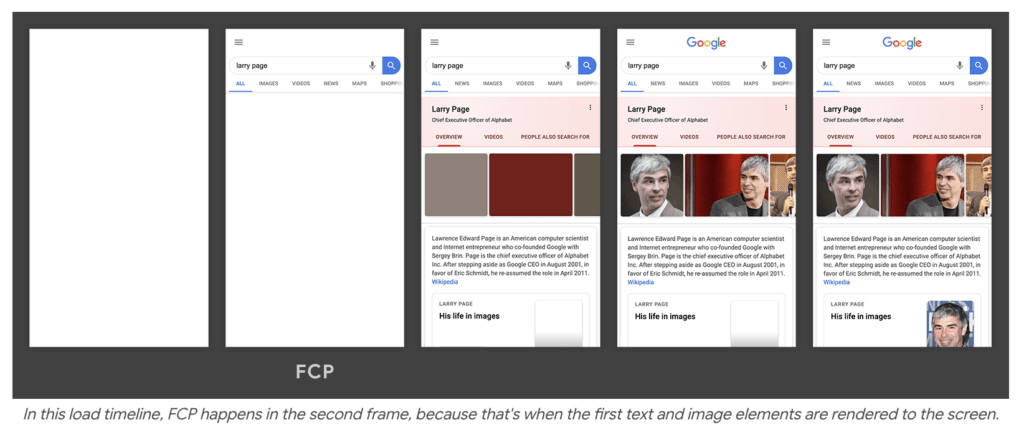
FCP example
The below screenshot shows the loading timeline. If you notice, the first content came up on the second screen. The time taken to reach there would become the FCP.
Why FCP matters
You might wonder, why is FCP being tracked? Why does the first content load time matter?
FCP is important because sometimes during page loads, there is background CSS or JS that is running first which delays the content to show up. If the difference between FCP and LCP is narrow, we know that it is not the content that is taking time to load.
Here is an example from our own website. We made some changes to the look and feel of the website and here is how our stats changed.
Here is BEFORE the format changes:
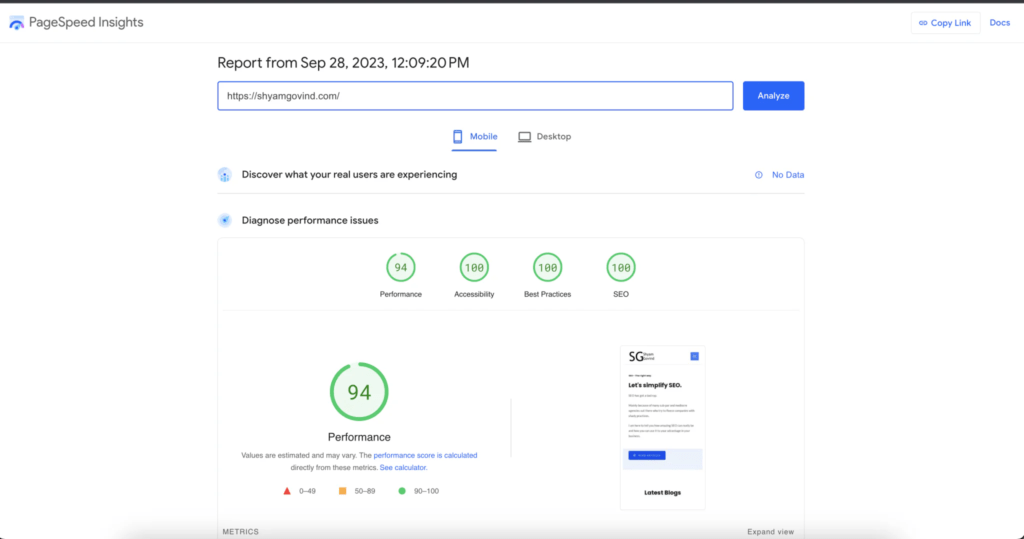
Here is AFTER the look and feel changes:
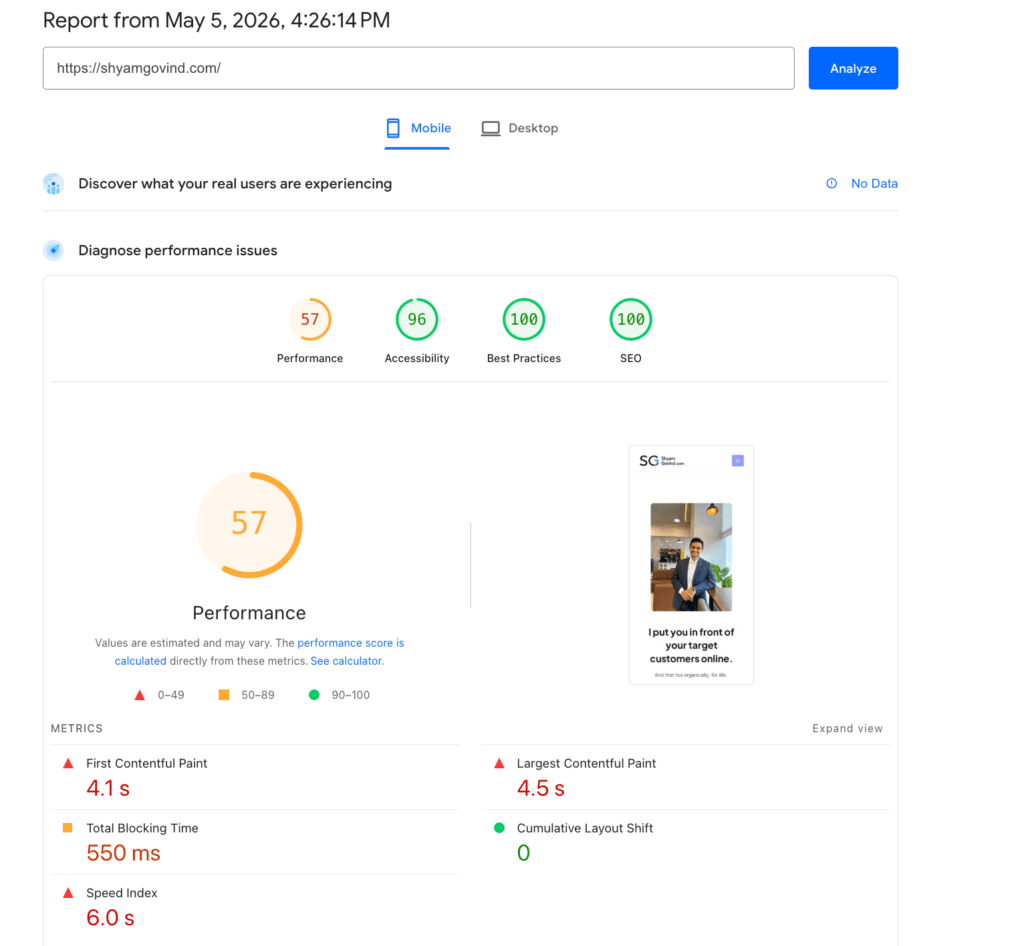
If you notice, the FCP score is 4.1 secs and LCP is 4.5 secs. This means it took 4.1 secs for the first piece of content to show up and the largest piece of content was displayed in the next 0.4 secs.
Clearly, there is some code that was running in the background which delayed the content loading. This helps us narrow down the issue and solve it.
How we solved the FCP issue
On analysis we realized the issue, we had enabled a particular set of fonts for our website and loading that was taking a lot of time.
We cleared the old CSS files from cache, minified font CSS files and changed how the font files load through a WordPress plugin.
And this is the result:

Notice how the FCP went from 4.1 secs to 2.8 secs. See how the scores instantly improved.
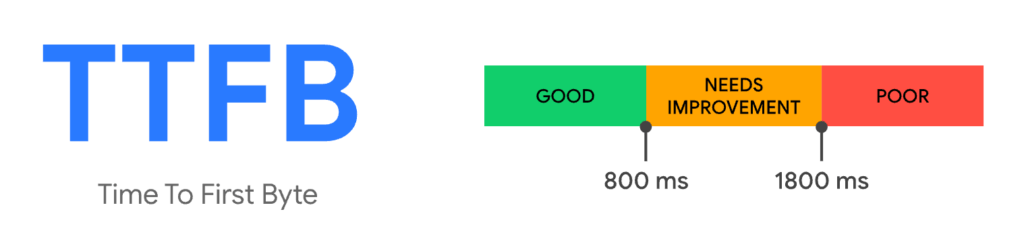
TTFB – Time to First Byte
Time to First Byte (TTFB) basically measures the time taken for the first byte of the page to come from the server. A byte as you might know is a data chunk.
In essence, it checks how long it took the web server to respond to the page request. This would then include the time taken to connect to the server and time taken by the web server to respond.
Going by its definition, it is clear that TTFB will happen much before the FCP. You have to connect to the server first before loading any content.
Why TTFB matters
If TTFB is too high, FCP and LCP will also be high. Knowing what the TTFB score is tells us if the issue is with the size of the page or the server on which the page is hosted.
TTFB value will precede every other metric we are tracking.
As per Google, TTFB must have a score of less than 800 ms.
TBT – Total Blocking time
TBT is a metric that tracks if some code is holding up the page loading for too long, in between when the first content was loaded to the point when the page became responsive to interactions.
It starts by looking at the tasks that run in the background and marks out any task that takes more than 50 ms to finish. (These are tasks that run to load the page)
For example, let’s say there are 5 tasks that run to load the page and each one takes the below times to finish (in milliseconds).
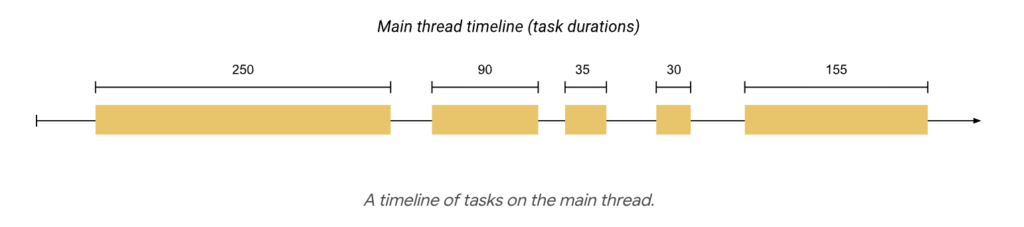
Now, in this clearly there are some of the tasks that are taking more than 50 ms to finish (i.e. the 1st, 2nd and 5th task). Let’s mark them.
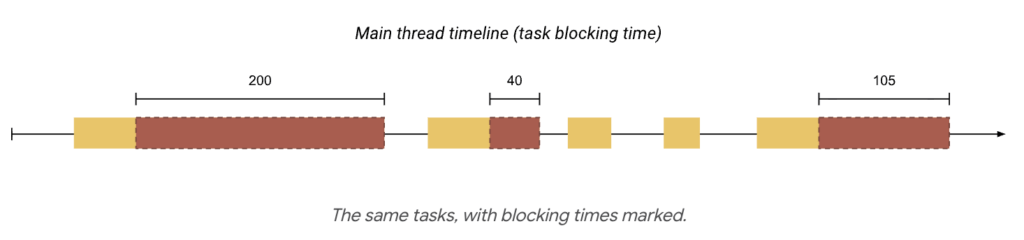
The marked portions are the blocking time. TBT for the page would be the total of all these blocking times (i.e. 200 + 40 + 105 = 345 ms in this case).
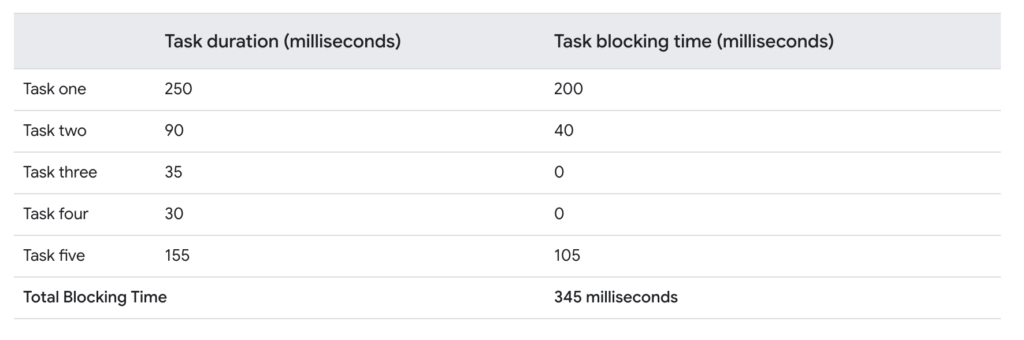
Google recommends a maximum TBT of less than 200 ms.
Speed Index
Speed Index is a performance metric that calculates how quickly content visually populates the page. This is a real-time metric that is measured by capturing a video of the page load on a browser and then the visual progression is captured frame by frame.
Here is an example of the how the frame-by-frame capture looks like in a Page Speed Insights report:
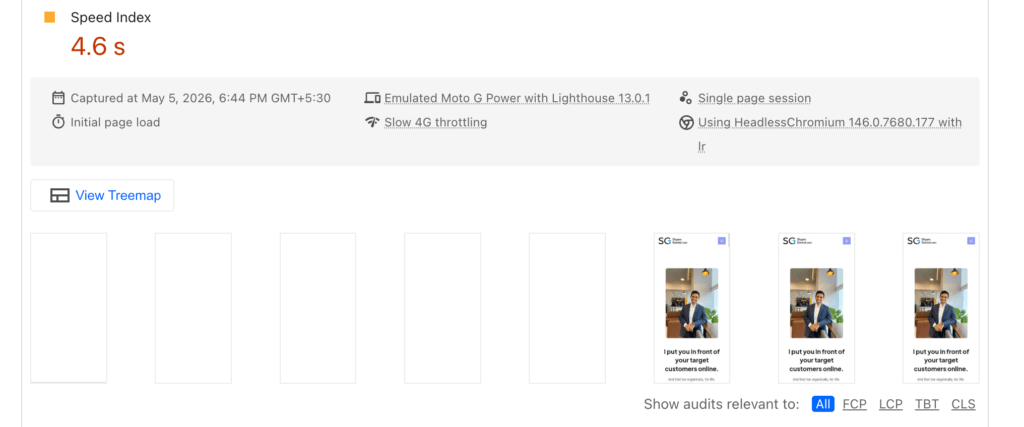
Google recommends a Speed Index of 3.4 secs or less.
How to test your Website’s Web Vitals
Now that you know everything you need to know about Web Vitals, let’s understand how to measure it.
There are four ways to test it through tools that Google provides:
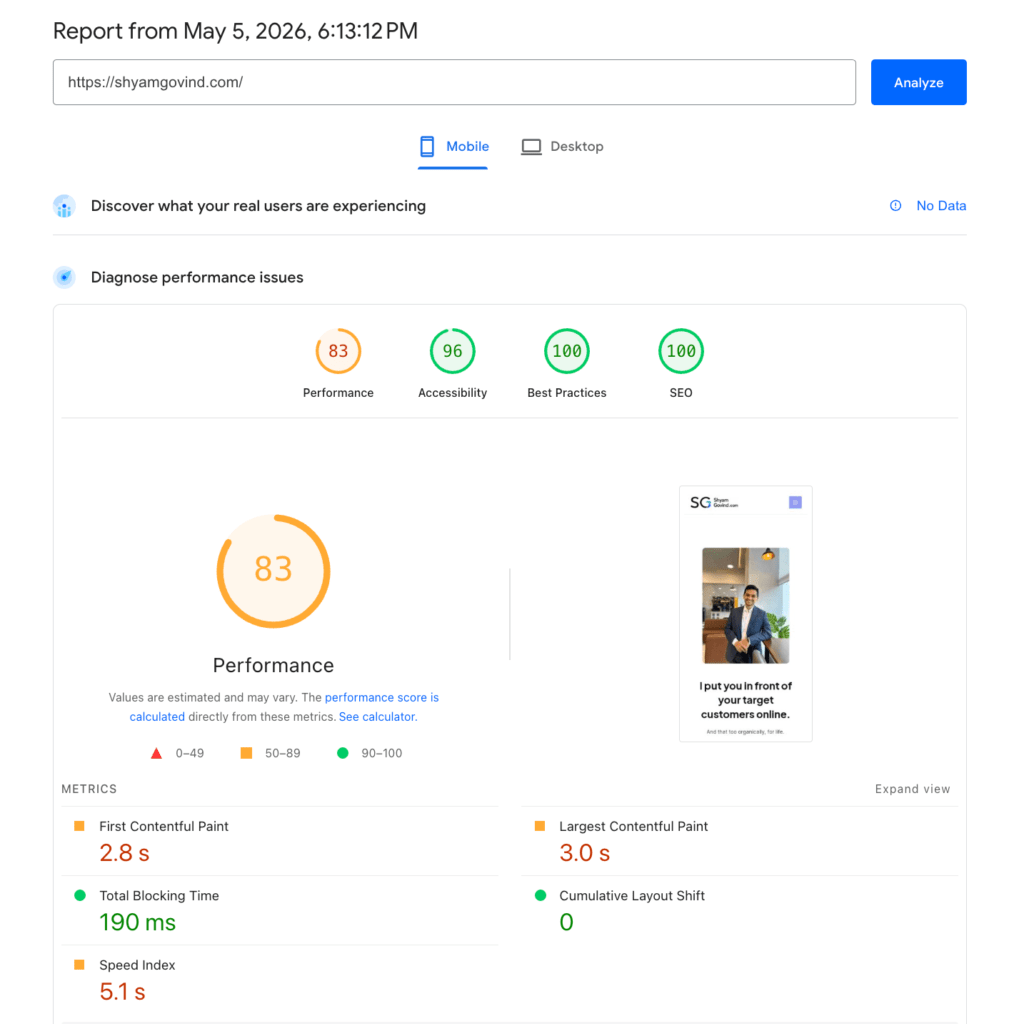
1. Page Speed Insights
This is the most often used tool that allows you to test any websites Web Vitals. Just put your website in the URL and get the Page Speed Insights report. Note this tool is giving a real-time test result and thus the test result will vary a bit every time you run.
Tool: https://pagespeed.web.dev/
You will see a report like below. Notice the section “Discover what your real users are experiencing” in the report and “No data” mentioned there. This is because Google is not capturing the website vitals regularly. So, Core Web Vitals – pass or fail report is missing.
For many websites, Google tests the Web Vitals regularly and saves it in a database. For them, you will see the Core Web Vitals Pass/Fail report. We cover this in a later section below (“Why Core Web vitals report is sometimes missing”).
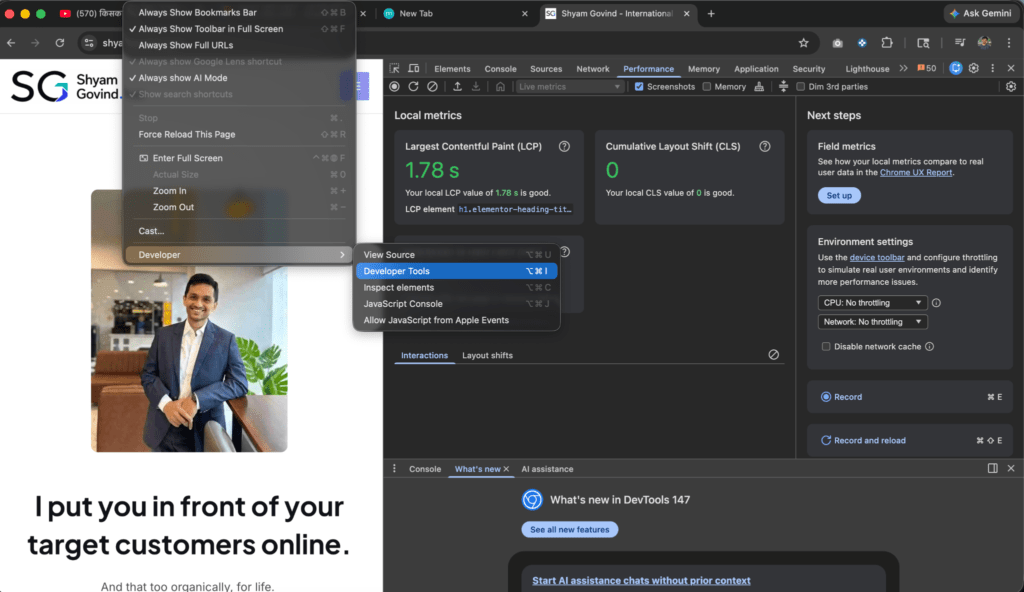
2. Chrome Dev Tools
If you use Chrome browser, you can simply go to the website you wish to test and then go to View > Developer > Developer Tools and click on the Performance tab to see the Web Vitals. This gives you the real-time test results.
Here is an example:
3. Search Console – Core Web Vitals
The first two methods give you real-time test results. There are two other ways to get real user experience stats on your Core Web Vitals. This is accessed through a rolling database that Google captures for some websites.
If your website is part of that, you will see a Core Web vitals report in your Search Console itself. This is how it will look:
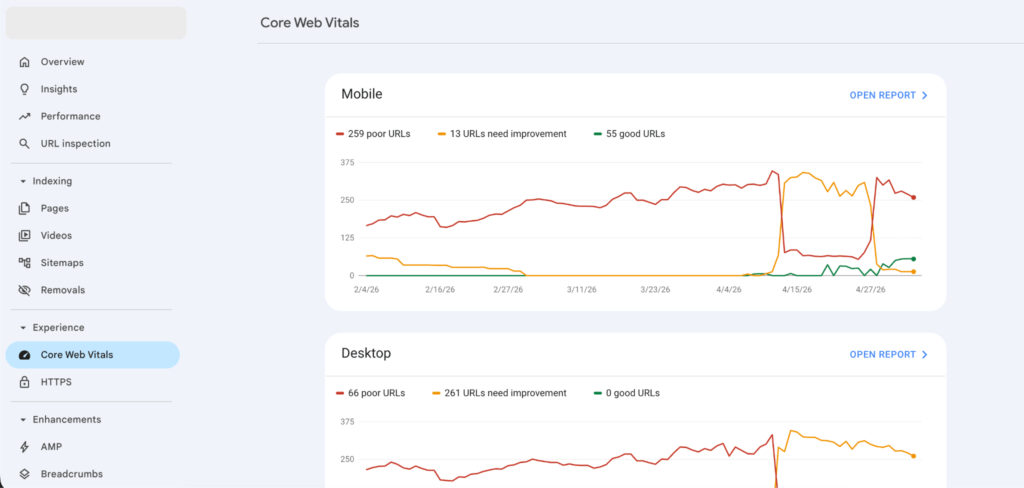
This is NOT a real-time test result. It is a summary of the real user experiences Google has observed on your website.
It is very useful data to work with if you have it because it gives you a page-level report on which pages passed the test and which didn’t.
4. Chrome User Experience Report
For websites where Google captures real user experiences, you can see historical Core Web Vitals report using tools like CrUX vis.
This tool basically uses Google’s database and charts out how the Core Web Vitals were across a time frame.
Here is an example below:
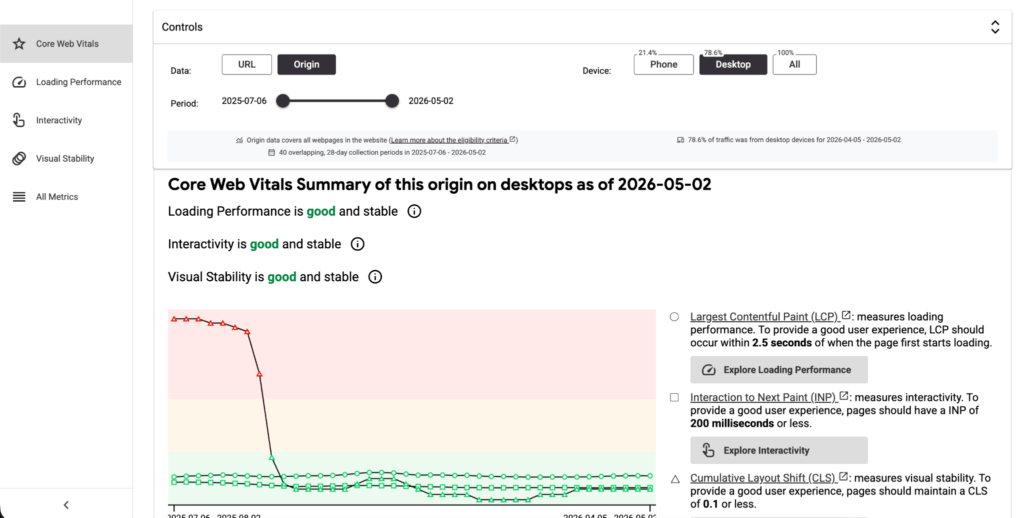
It tells you how the values changed over time for the website for different devices.
You also get an option to see the Web Vitals for the whole website instead of just one page (by choosing “Origin” in the Controls section).
Why Core Web vitals report is sometimes missing
As mentioned, not all web sites get a Core Web Vitals report. This is because Core Web Vitals report is generated on real user experiences that is captured by Google over time. It is NOT a real-time report.
To get that report, the website has to be a part of the Chrome User Experience Report or CrUX. In short, CrUX is a public database maintained by Google that captures the Core Web Vitals scores of millions of websites. The database is a rolling average of the scores from the last 28 days.
If your website is part of that, then the Web Vitals data is getting captured continuously by Google and hence it can show the Core Web Vitals report.
If you are not part of it, you will see a screen like this in the Google Search Console:
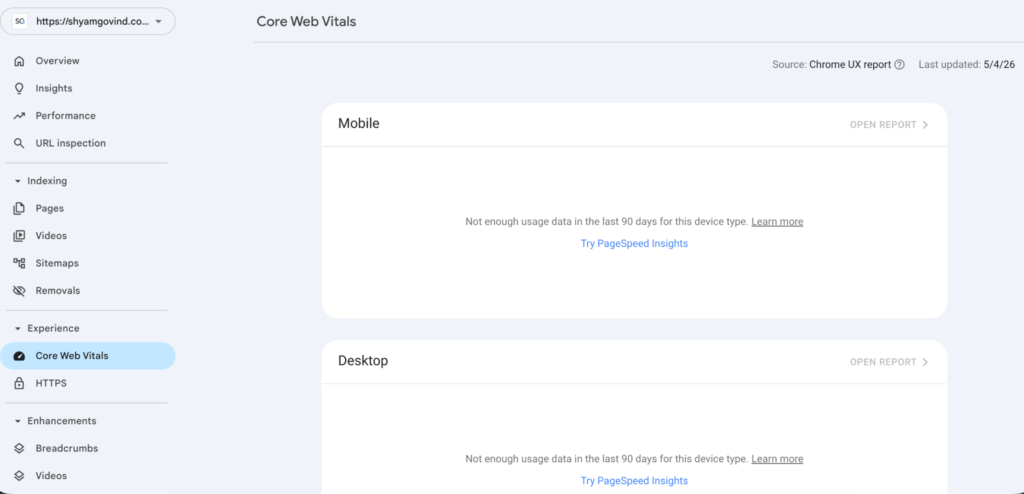
This is ok. Not all websites are part of the CrUX database.
We can still get the live values of Core Web Vitals for our website using the first two tools mentioned earlier.

How does a website pass Core Web Vitals
As we discussed, the CrUX data is a rolling average over the last 28 days. Your website’s Core Web Vitals on CrUX are just the average of the scores across these 28 days.
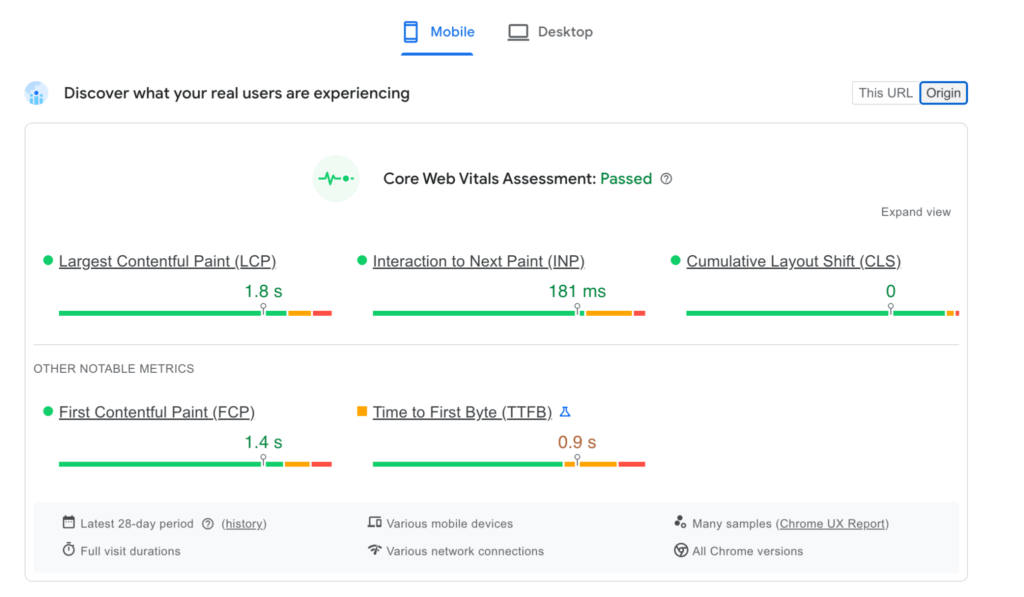
To pass Core Web Vitals, at least 75% of a site’s user experiences must meet the “Good” threshold for all three metrics.

Here is how a Core Web Vitals report looks like for a website that passes the test:
CMO takeaway: Why Web Vitals matter
Google uses these metrics directly to assess the quality of the website. A website that has low scores on these metrics essentially gives bad user experience (UX) to the visitor.
This means, if Google shows these websites high on search and a user visits the website and gets a bad experience – it blames Google for showing that website in the search results.
In other words, showing a website with low Web Vitals on search results directly impacts Google Search’s user experience. And Google will not do that.
CMO Action step:
We suggest testing your website’s web vitals once every month.
If your website has low Web Vitals – please work with your tech team and make your website pass the Core Web Vitals test. Improving them will disproportionately improve your search rankings.
You can share the below recommendations from Google to the tech team, one for each metric you wish to improve:
Hope this helps,
Shyam